Advanced reporting and statistics for freelancers and small teams
Published {$created} by Tina Blum
Time tracking is more valuable if you can make sense of the data afterward.
It's not just data, it also:
Improves planning
Justifies invoices
Avoids scope creep
Monitors team workload
Backs decisions with real data
Logging hours is just one side of the story. The real value lies in understanding where your time goes, how your team is progressing, and whether you’re staying on budget.
If you can see these things, you are able to make your work more efficient, which will lead to satisfied customers.
Whether you’re a freelancer working across multiple clients or a small team managing ongoing projects, our reporting tools help you see how your hours are spent and where and what to change.
All the Reports You Need – Nothing You Don’t
Nureti includes a carefully selected set of reports designed for real daily use:
Project reports
User reports
Task-based reports
Weekly burn-up charts
Entry-level logs
Custom dashboard widgets
You can filter everything by user, project, task, or time period.
Different reports:
Project Reports: Stay on Track
See exactly how much time has been logged on each project, by whom, and over what time period. Spot delays early, reallocate resources, or adjust timelines before small issues become big problems.
User Reports: See Team Contribution
Need to check if someone is overloaded? Or perhaps under-booked? User reports help you monitor individual time usage across projects—ideal for small teams where transparency and balance matter.
Task Reports: Know Where Time Goes
Break down time per task to see which parts of your workflow consume the most effort. Perfect for identifying what’s draining your hours—and improving estimates for future projects.
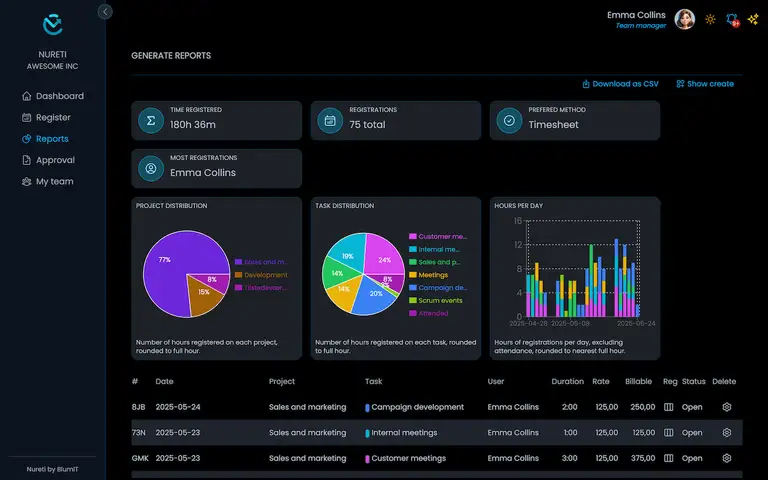
Dashboard
Besides the reports, we also have the dashboard. You have different possibilities to get the views you need.
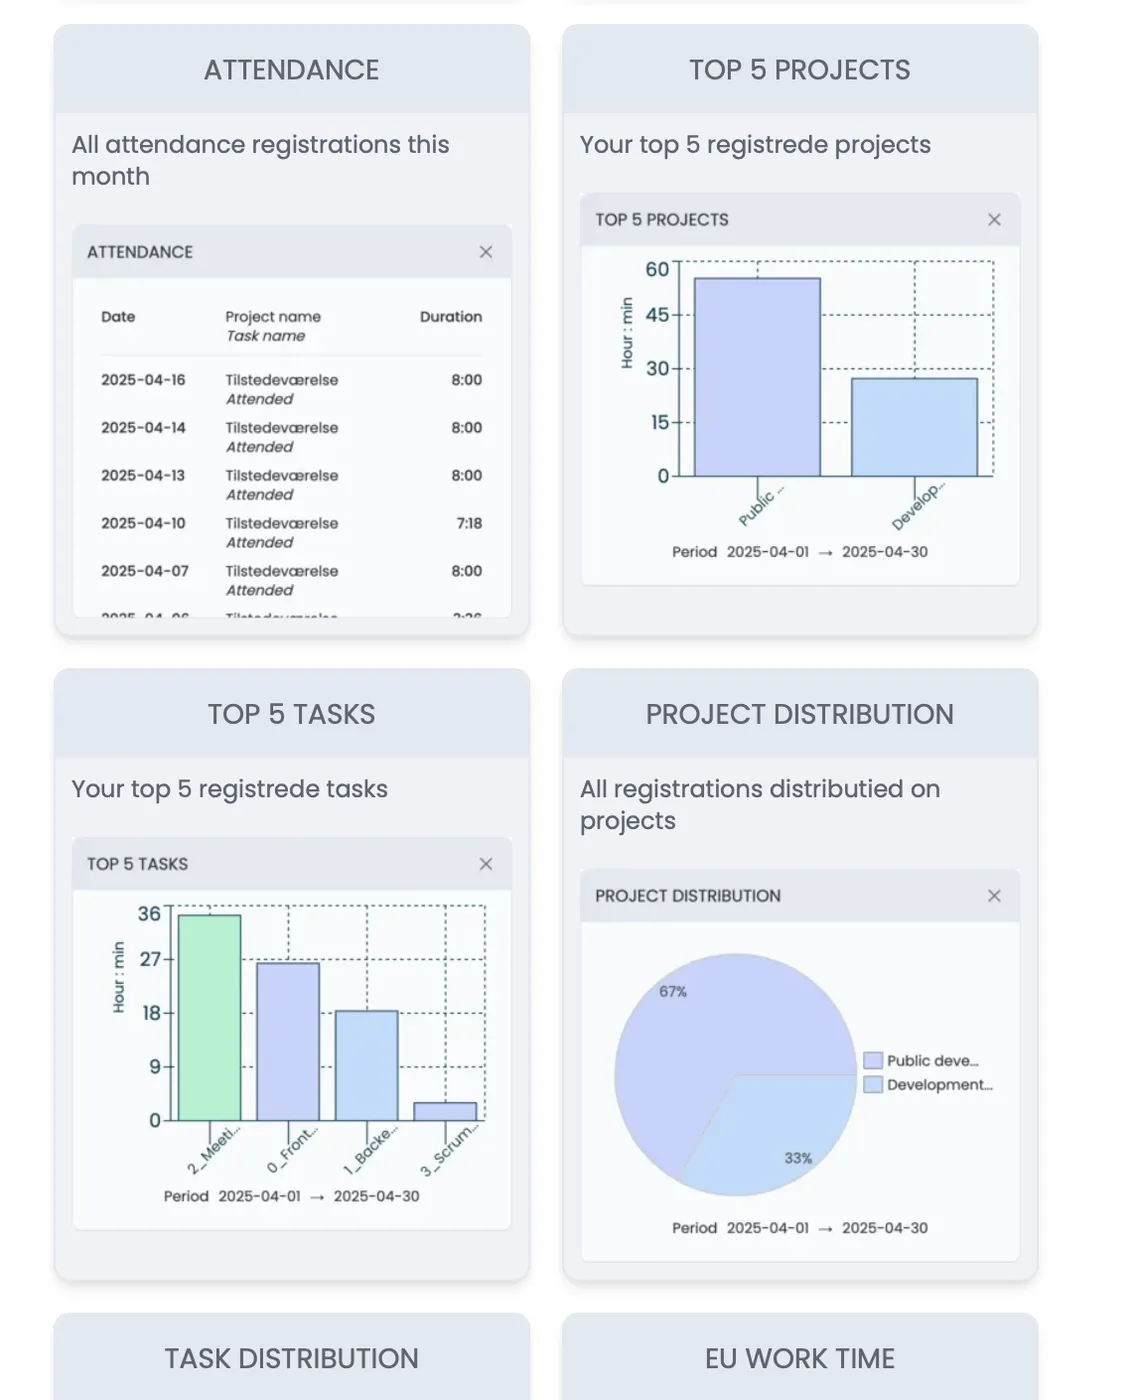
Visual Progress with Burn-Up Charts, week registrations, top 5 tasks and more
The Week Burn-Up chart gives you a visual overview of how time is being registered across tasks and users. It’s a simple, intuitive way to see trends, spikes, and gaps in activity—without reading rows of numbers.
Week registrations give you a quick view of registered time from the last week.
Top 5 tasks will show you which tasks are most used.
There are more than 10 different widgets to use.
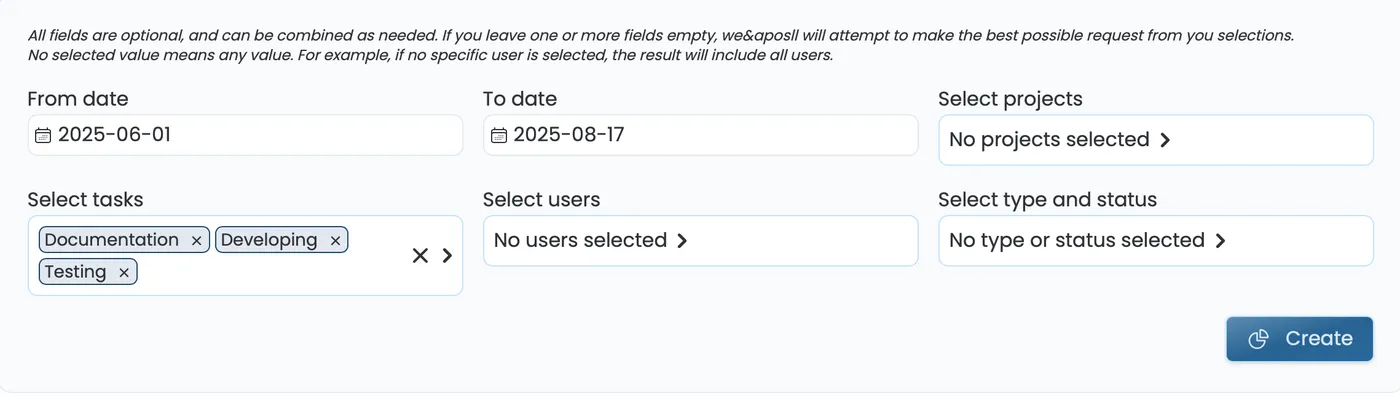
Filter, Export, and Share
All reports in Nureti can be filtered by date range, user, project, or task. Need to send an update to a client or accountant?
Choose your date range, project, task, user, type, and status. All of them or just some.
Click create report, and then download your report to CSV.
Then you can send the report and your client will get the insight they need.
Reports That Help You Get Paid
Every hour counts, especially when billing clients. Nureti’s reports make it easy to:
Prove work has been done
Attach documentation to invoices
Answer client questions with confidence
Whether you bill hourly or by project, clear time reports mean faster payments and fewer disputes.
Simple Enough for Freelancers. Powerful Enough for Teams.
You don’t need to spend hours setting up dashboards or learning a new tool. With Nureti, everything is ready to go. Start tracking, open your reports, and see exactly what you’ve achieved.
Try Nureti for free and make your hours work for you.